Adhesion Test
Measures the peak force to separate a probe from the sample surface — rating stickiness.
Part 1
What is Adhesion Test
The adhesion test evaluates how a sample sticks to a contact surface. The probe touches the sample, then separates; the peak force needed to pull it away rates the stickiness. It is widely used for foods, packaging, adhesives and cosmetics.
Application Domains
Texture Properties Measured
Part 2
Principle & Operating Procedure
Principle
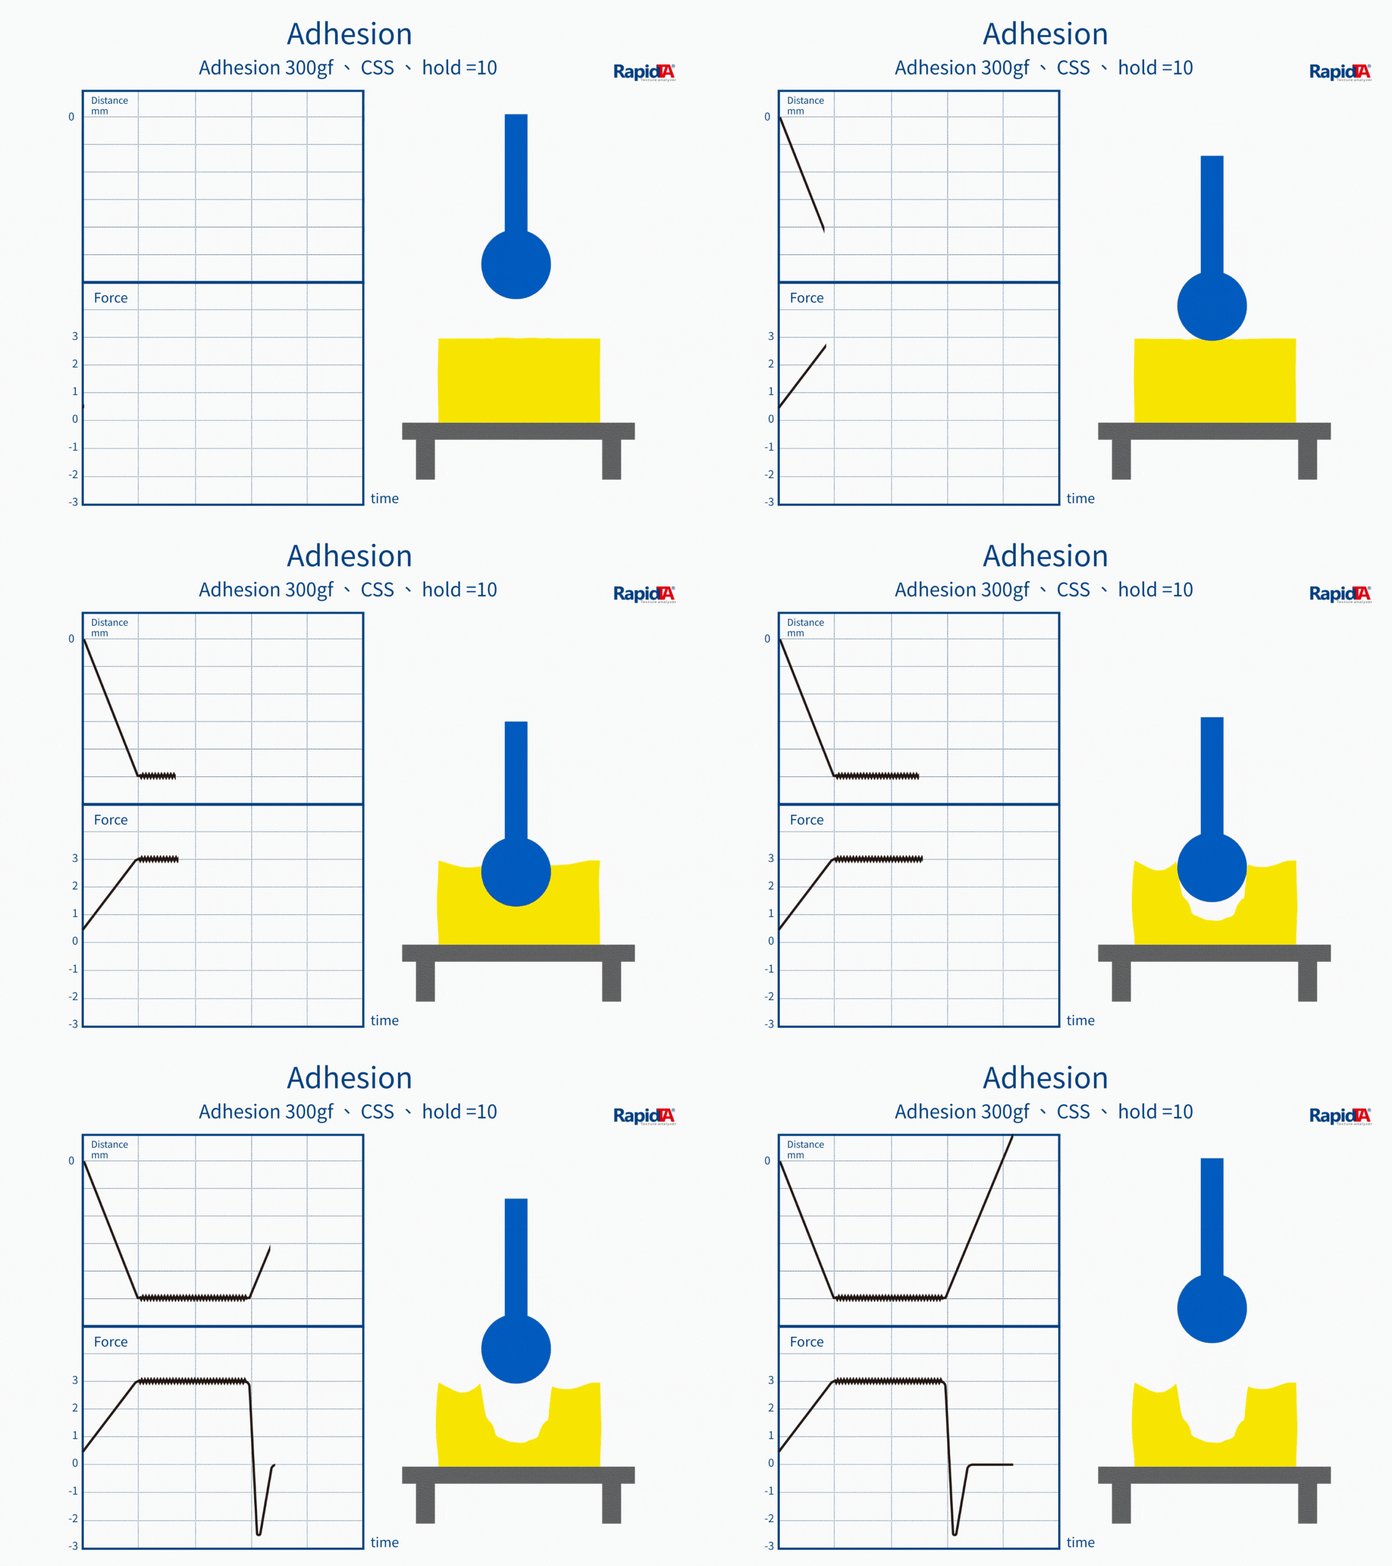
The probe contacts the sample surface, holds, then separates. The peak force needed to pull it away rates the stickiness, in three phases: contact, hold and separation.
Operating Procedure
Prepare the sample
Place a flat, bubble-free sample, 3–10 mm thick, on the stage.
Contact and pre-load
The probe descends at the set speed (typically 1–5 mm/s) and applies a set pre-load.
Hold contact
Hold for a set time (typically 5–30 s) so the sample bonds to the probe.
Separation
The probe pulls away at the set speed (typically 0.5–10 mm/s) while force is recorded.
Record and analyze
Peak adhesive force, adhesive work and separation distance are recorded automatically.
Recommended Settings
Standard or suggested parameters by sample and application — use them as a starting point.
Recommended settings by sample type
| Sample type | Contact speed | Contact time | Withdrawal speed | Remark |
|---|---|---|---|---|
| Liquids / ointments | 1–2 mm/s | 5–10 s | 1–5 mm/s | Avoid splashing |
| Adhesives | 0.5–1 mm/s | 30–60 s | 1–10 mm/s | Needs longer time to bond |
| Food stickiness | 2–5 mm/s | 3–5 s | 1–3 mm/s | Mimics mouthfeel |
| Biomaterials | 0.1–1 mm/s | 10–30 s | 0.5–2 mm/s | Needs temperature control |
Core parameter ranges
| Parameter | Range | Effect |
|---|---|---|
| Contact speed | 0.1 – 10 mm/s | Affects initial contact quality |
| Contact force | 10 – 10,000 gf | Contact pressure between probe and sample |
| Contact time | 1 – 300 s | Sets how strongly the bond forms |
| Withdrawal speed | 0.1 – 50 mm/s | Affects the measured adhesion |
| Trigger force | 1 – 1,000 gf | Defines the start point |
| Test temperature | 5 – 80 °C | Optional temperature control |
Part 3
Probe Selection & Characteristics
Probe and fixture choice strongly affects accuracy and repeatability. The probes and kits below are commonly used for this action — select one to see its samples.
Flat probe
Ø 10 / 25 / 35 mm
Viscous liquids, ointments, glues
Even contact; the most common
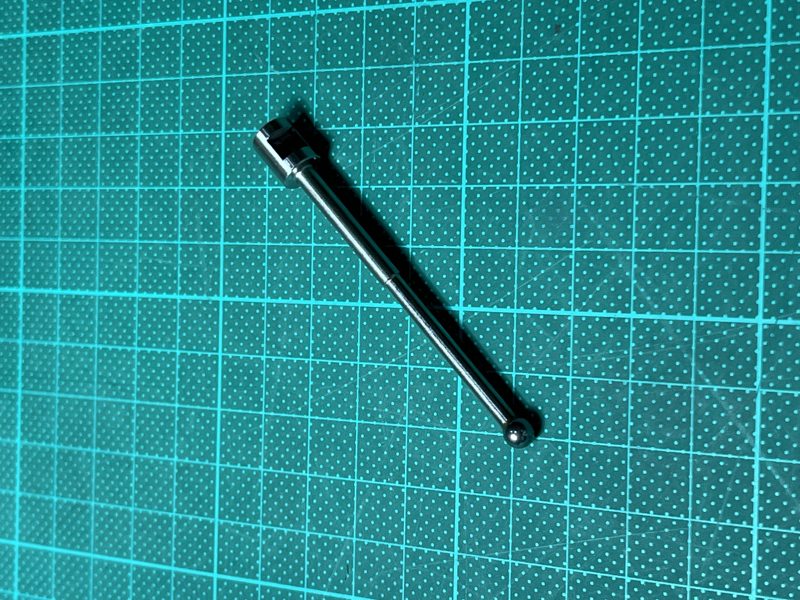
Spherical probe
Ø 5 / 12.7 / 25 mm
Irregular surfaces or spot stickiness
Point contact for local variation
View probe & test kit →
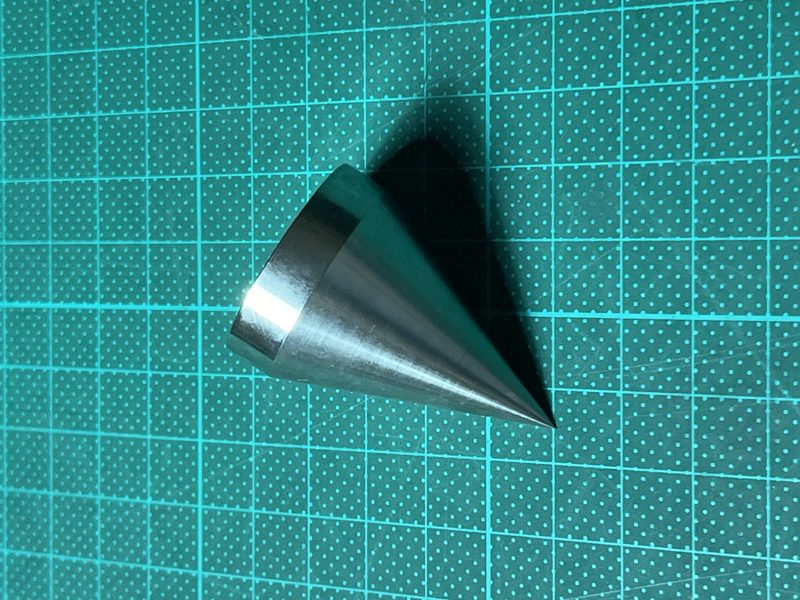
Cone probe
30° / 45° / 60°
Skinned samples or layered materials
Penetrates the skin to measure internal stickiness
View probe & test kit →
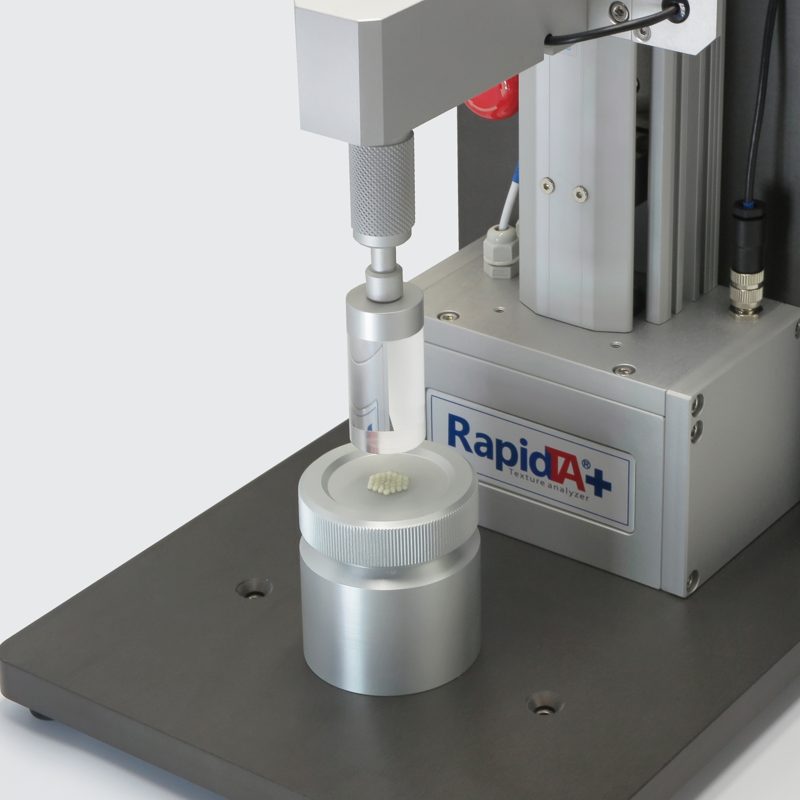
Dough adhesion rig
DAT
View probe & test kit →
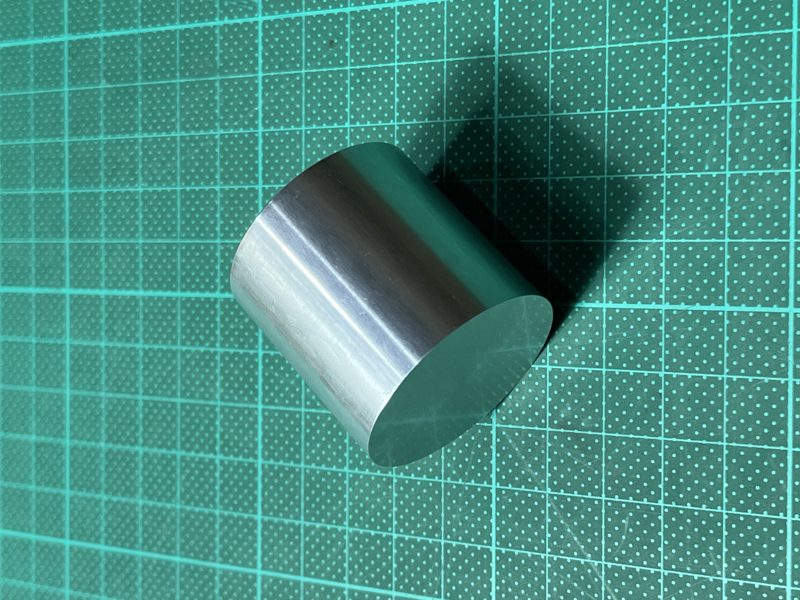
φ 36 mm cylinder probe.
CY36
View probe & test kit →
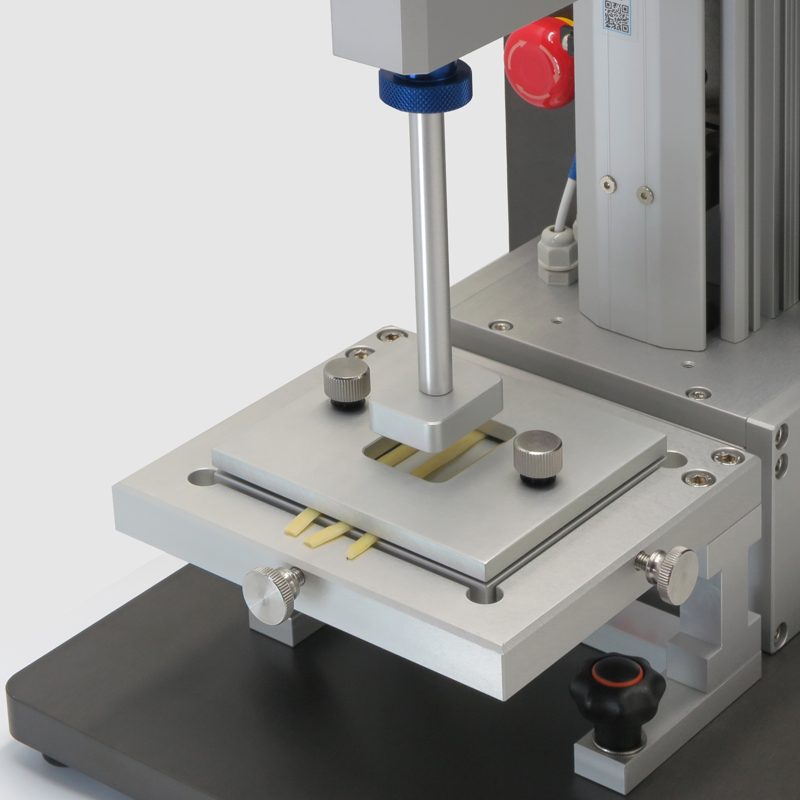
Noodle stickiness rig
NSR
View probe & test kit →
Part 4
Data Interpretation & Analysis
A typical adhesion curve has contact, hold and separation phases. The largest negative force during separation is maximum adhesive force. The area under the negative force curve in separation is adhesive work (J or mJ), which reflects bond strength and persistence. Separation distance shows how far the bond stretches before it breaks.
Test Curves & Diagrams


Parameters & Calculations
After a test, the software calculates these parameters from the curve
Maximum adhesive force
Largest negative force during separation — the strongest bond, the key indicator.
Adhesive work
Area under the negative-force curve — total energy to break the bond.
Separation distance
Distance from start of separation to full release — reflects extensibility.
Part 5
Application Cases
Applicable Test Samples
These samples use this action — select one for the full test information
Application Cases & Data Examples
Food industry
Samples: honey, syrups, sauces, butter. Purpose: rate stickiness, spreadability and mouthfeel to optimize formulas, control batch consistency and develop products. Typical: adhesive force 0.1–5 N, contact 3–10 s.
Pharmaceutical industry
Samples: capsules, drug films, bioadhesives, drug carriers. Purpose: evaluate release, biocompatibility and mucosal adhesion to ensure efficacy and compliance. Typical: 0.01–1 N, 37 °C controlled.
Cosmetics industry
Samples: foundation, mascara, lipstick, face masks. Purpose: rate longevity, feel and adhesion. Typical: 0.05–2 N, withdrawal 1–10 mm/s.
Packaging
Samples: tapes, labels, sealants, films. Purpose: bond strength, durability and peel behavior to keep packaging intact. Typical: 1–50 N, contact 10–300 s.
Part 6
Frequently Asked Questions
How do I choose an adhesion probe?
Liquids: flat probe for even contact. Solid surfaces: spherical probe for local tests. Irregular samples: a custom probe. Stainless steel suits general use; special coatings can mimic real-world surfaces.
How does contact time affect results?
Too short and the bond may not form; too long and the sample may change. Liquids usually 3–10 s; adhesives 30–60 s. Run a pilot test to find the best contact time.
How does withdrawal speed affect results?
Fast separation usually gives higher adhesion but is less precise; slow separation is more accurate but may underestimate. Choose speed to fit the application, typically 1–10 mm/s.
How does temperature affect adhesion testing?
Temperature is a key factor: higher temperature usually lowers viscosity and changes adhesion. For temperature-sensitive samples, use temperature control to keep conditions consistent. Biomaterials are usually tested at 37 °C to simulate body temperature.
How do I make adhesion results repeatable?
Key steps: standardized sample prep, fixed parameters, regular calibration, controlled temperature and humidity, and a clean probe face. Repeat at least 5–10 times and report mean and standard deviation.
Related Test Actions
Compression Test
Measures mechanical response under compressive load — for hardness and springiness.
Learn More →
TPA (Texture Profile Analysis)
One test returns hardness, springiness, cohesiveness and more — simulating human chewing.
Learn More →
Extrusion Test
Forward, back and bulk extrusion — rating consistency, firmness and crispness.
Learn More →
Not sure which texture test method fits your product?
Feel free to share your testing needs anytime — we provide free test method recommendations, custom fixture selection, instrument model suggestions, and tailored quotes.