Cutting / Shear Test
Mimics teeth cutting through food — measures maximum shear force and fracture behavior.
Part 1
What is Cutting / Shear Test
The shear test drives a dedicated blade through the sample at a constant speed while a sensitive load cell records the force throughout the cut. Unlike compression, it mimics teeth biting through food, and the peak shear force indicates hardness or toughness.
Application Domains
Texture Properties Measured
Part 2
Principle & Operating Procedure
Principle
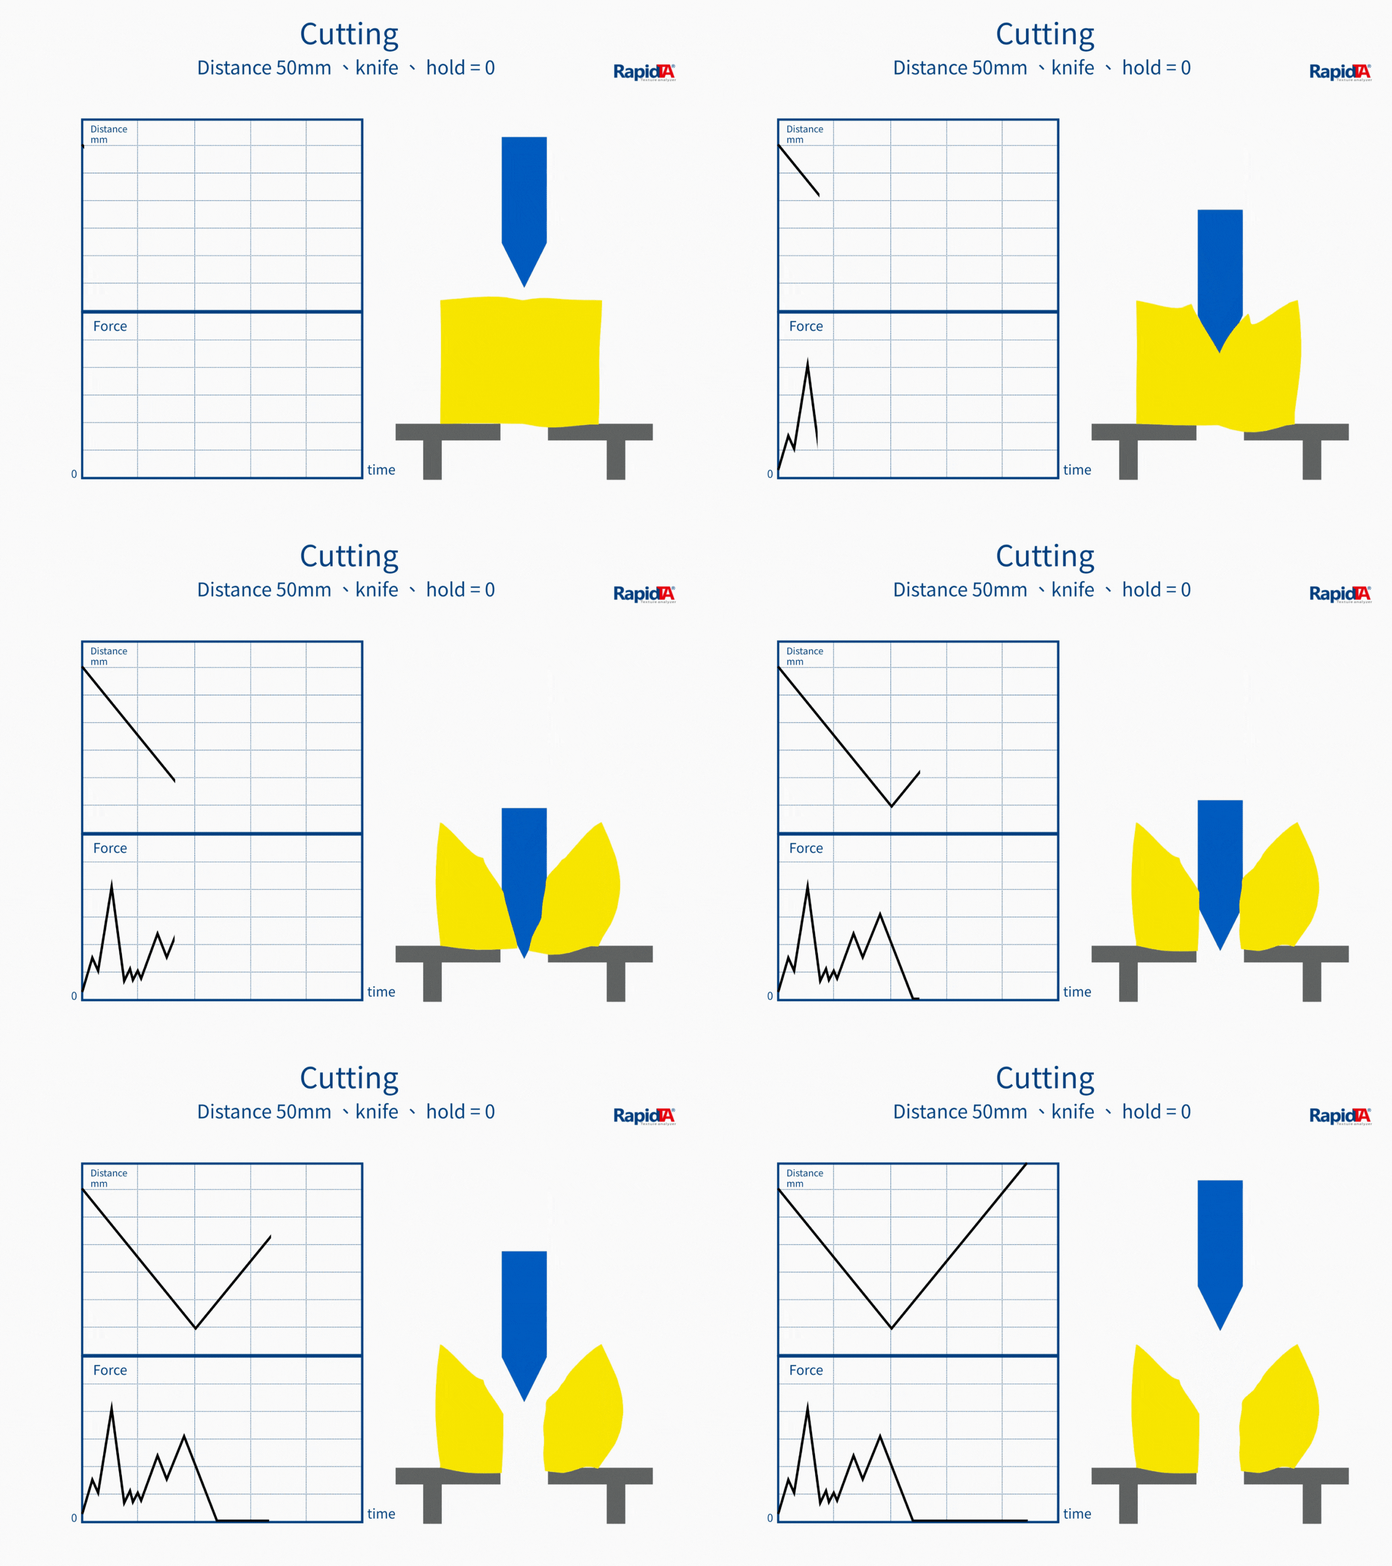
A cutting probe drives down through a sample held on the stage at a fixed speed while a load cell records the whole cut. The peak shear force indicates hardness or toughness — closer to how teeth cut food than compression.
Operating Procedure
Position the sample
Place the sample in the slot or shear cell, centered on the blade, and record its size.
Trigger and start
The probe moves down; recording starts at the trigger force (e.g. 25 gf) to exclude free travel.
Cutting
Cut at a fixed speed (e.g. 2 mm/s); force peaks as the sample breaks, then falls.
Reach target depth
The probe continues to the set distance (e.g. 5 mm), capturing the full cut.
Return and calculate
The probe returns; the software calculates peak force (hardness) and shear work.
Recommended Settings
Standard or suggested parameters by sample and application — use them as a starting point.
Standard settings (biscuit example)
| Speed | Test mode | Start (trigger) | Target | Hold |
|---|---|---|---|---|
| 2 mm/s | Distance (c) | 25 gf | 5 mm | 0 sec |
Part 3
Probe Selection & Characteristics
Probe and fixture choice strongly affects accuracy and repeatability. The probes and kits below are commonly used for this action — select one to see its samples.
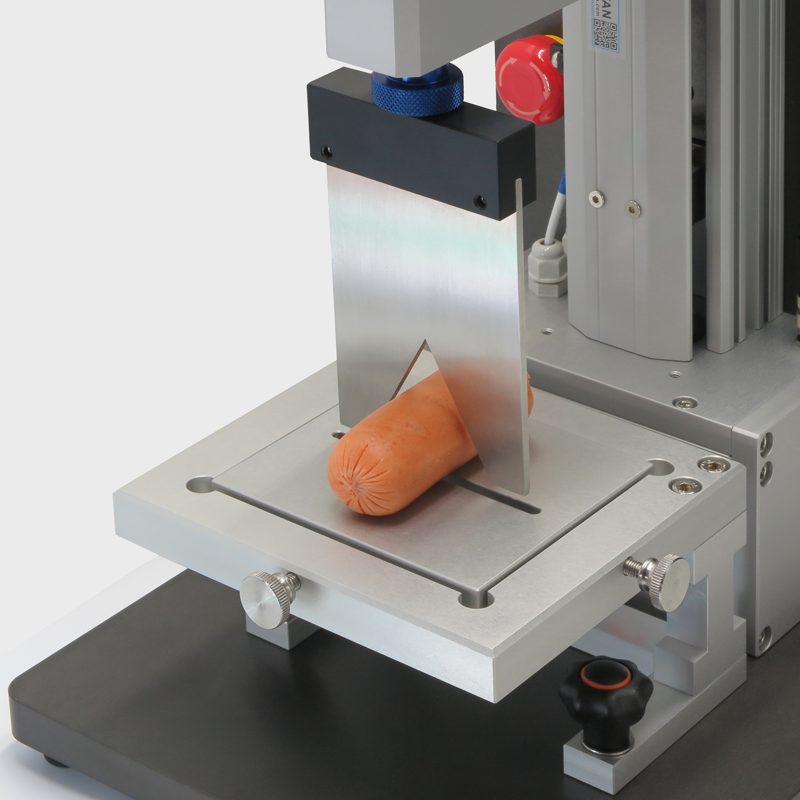
Warner–Bratzler blade
Standard shear blade
Biscuits, croissants, meat, cheese
The most common shear blade; results comparable to literature
View probe & test kit →
5-blade Kramer shear cell
Bulk shear
Cereal bars, dried corn, peas, pickles
Cuts many points at once for batch-level results
View probe & test kit →
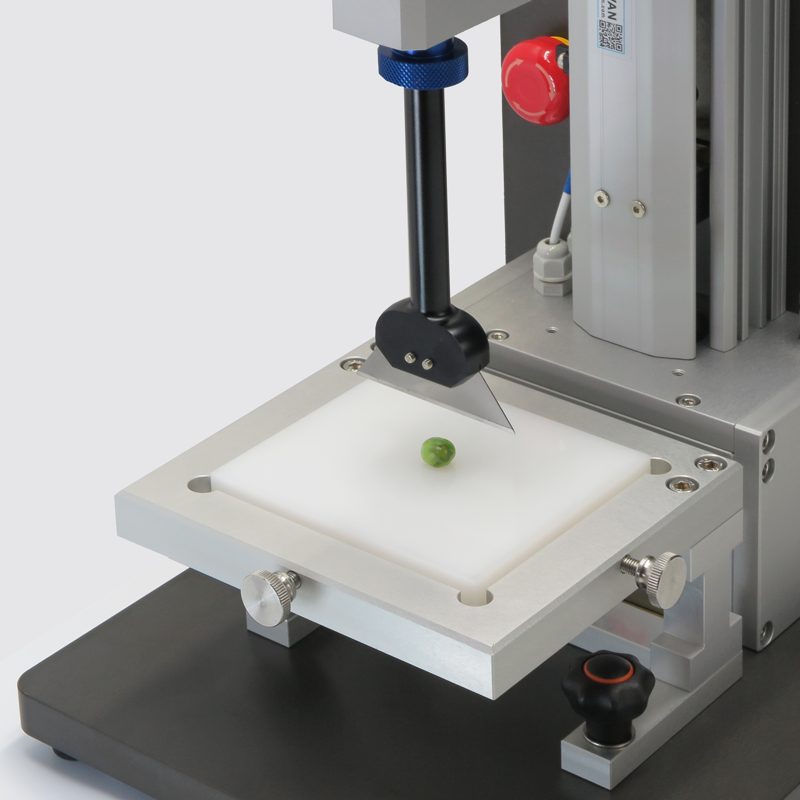
Sharpness knife
Extended blade
Gum tablets, hard candy
Measures outer and inner hardness
View probe & test kit →
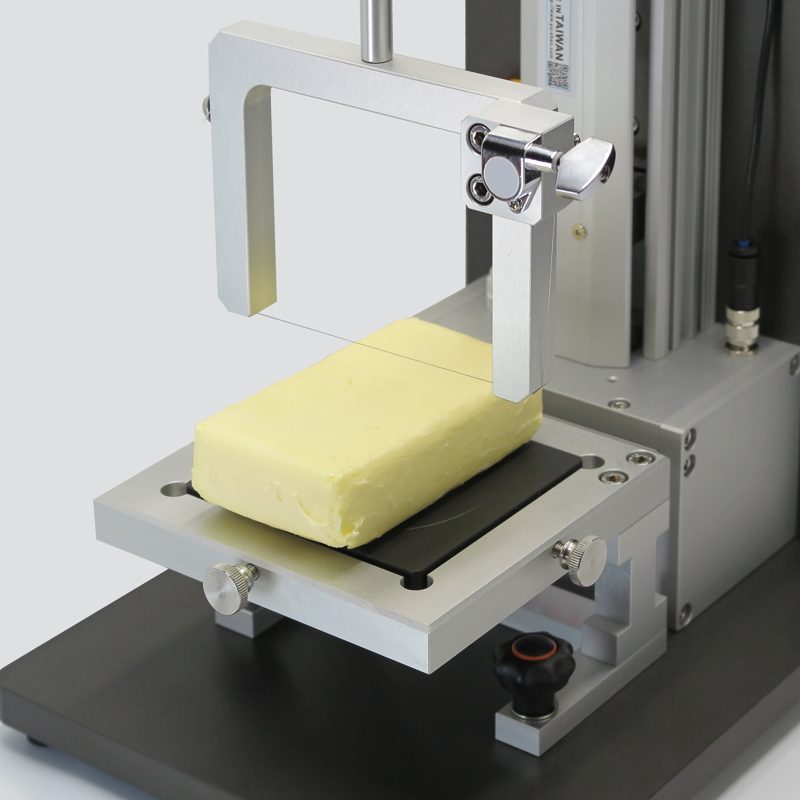
Wire butter cutter
Wire blade
Butter, margarine, cheddar
Cutting force for soft solids
View probe & test kit →
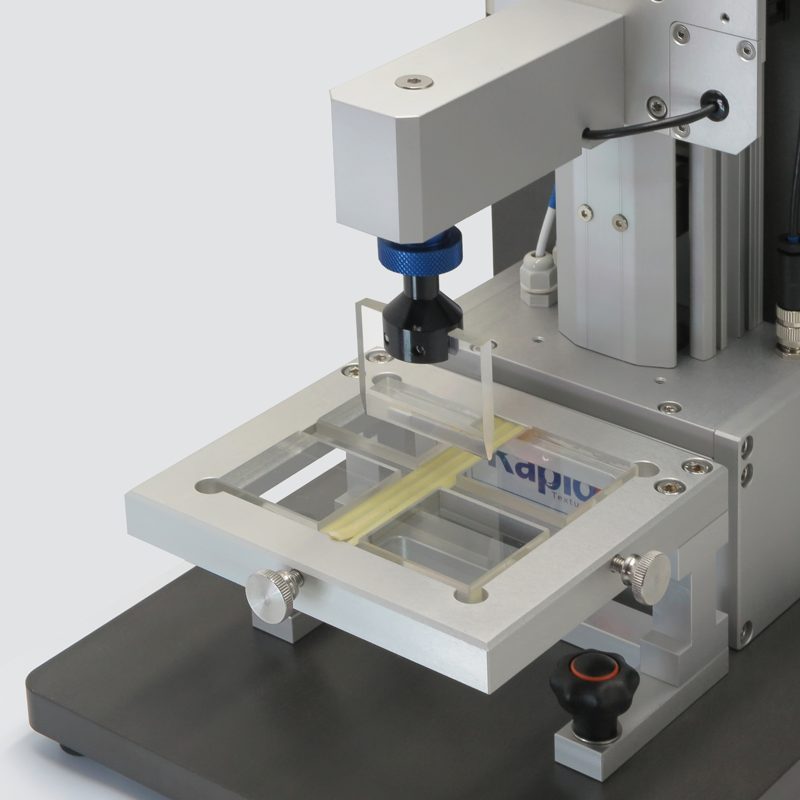
Acrylic knife set
Acrylic blade set
Cooked pasta (AACC 16-50)
Standard-method pasta testing
View probe & test kit →
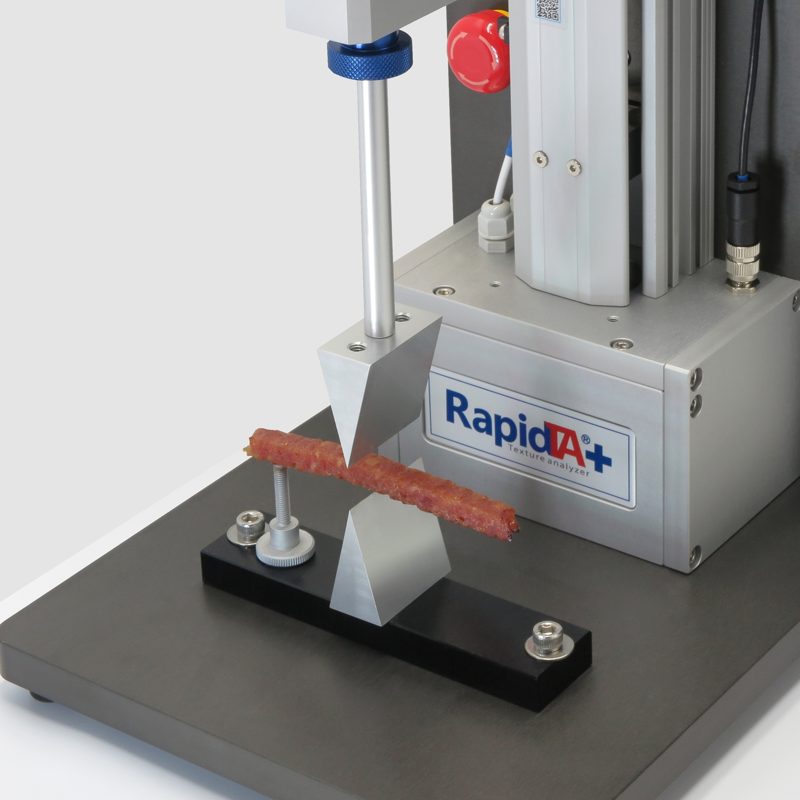
Dual wedge rig
DWS
View probe & test kit →
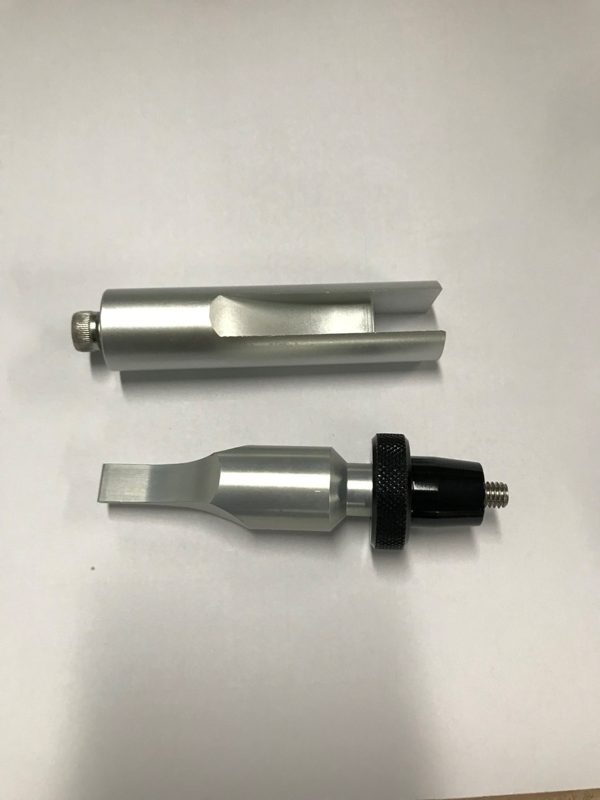
Simulated incisors rig
SIR
View probe & test kit →
Part 4
Data Interpretation & Analysis
The maximum force is shear resistance (hardness or toughness). The area under the curve is shear work — the total work to cut through the sample, which can describe tough samples without a clear peak (e.g. dried figs, pitted dates) better than peak force. The number of peaks and their fluctuation reflect brittleness and structural uniformity.
Test Curves & Diagrams
Chart coming soon
[TBD] No chart is available for this test action yet
Parameters & Calculations
After a test, the software calculates these parameters from the curve
Max shear force
Peak force during the cut — hardness or toughness.
Formula:Peak positive force of the shear curve
Work of shear
Area under the cut curve — total energy to cut through.
Formula:Shear curve area
Average shear force
Average force over the plateau — sustained cutting resistance.
Part 5
Application Cases
Applicable Test Samples
These samples use this action — select one for the full test information
Biscuits/Cookies
Food
Chocolate coated wafer biscuits
Food
Breakfast toaster pastries
Food
Croissants
Food
Cereal bars
Food
Chewing gum tablets
Food
Butter & margarine
Food
Cheese
Food
Processed cheddar cheese
Food
Ice cream
Food
Hydrated sweetcorn
Food
Dried pitted dates
Food
Pitted olives
Food
Peaches
Food
Peas
Food
Potato
Food
Tofu
Food
Diced tomatoes
Food
Cooked chicken breast
Food
Chicken nuggets
Food
Ham
Food
Prawns
Food
Hot dogs
Food
Sausages
Food
Surimi
Food
Cooked pasta
Food
Pasta Shapes
Food
Extruded snack
Food
Almonds
Food
Pickle
Food
Application Cases & Data Examples
Blade guide
Warner–Bratzler: biscuits, croissants, meat, cheese. 5-blade Kramer cell: cereal bars, dried corn, peas, pickles. Acrylic knife set: cooked pasta (AACC 16-50). Wire butter cutter: butter and margarine.
Part 6
Frequently Asked Questions
How do I choose a shear probe?
Single samples (biscuits, meat, fruit): Warner–Bratzler blade. Batches of pieces (canned vegetables, diced meat, cereal bars): Kramer batch shear set. Soft dairy: wire cheese cutter. Food with an outer and inner layer (gum, almonds): sharp blade.
How does shear differ from TPA compression?
Shear simulates incisor cutting with one pass, measuring cutting resistance (hardness/toughness) as peak force and shear work. TPA simulates full chewing with two compressions for 8–9 texture parameters. Shear suits fast QC acceptance; TPA suits in-depth texture analysis.
Why do biscuits with inclusions show more variable shear results?
Biscuits with nuts, chocolate chips or dried fruit are uneven. If an inclusion sits on the blade path it can strengthen or weaken the local structure and swing the reading. Raise the trigger force to avoid early triggering and repeat at least 10 times to assess the overall spread statistically.
What is the advantage of the Kramer batch shear?
It cuts several samples at once (5 or 10 blades), reducing the effect of individual variation. It suits irregular pieces such as peas, corn and shrimp. Batch results have lower SD and represent the batch better — good for batch acceptance and comparison.
How much does temperature affect shear results?
Temperature has a big effect, especially on fatty foods (butter, cheese, chocolate) and frozen foods (ice cream). Warmer fat softens and shear force drops; cooling raises hardness. Run all comparisons at the same temperature and record it in the report.
Related Test Actions
Puncture Test
Measures puncture resistance — surface hardness, fracturability and gel strength.
Learn More →
Compression Test
Measures mechanical response under compressive load — for hardness and springiness.
Learn More →
Bending Test
Three-point bending measures deflection and breaking force for brittle products.
Learn More →
Not sure which texture test method fits your product?
Feel free to share your testing needs anytime — we provide free test method recommendations, custom fixture selection, instrument model suggestions, and tailored quotes.