
Stress Relaxation Test
Holds the probe at depth and tracks force decay over time — elastic recovery and shelf life.
Part 1
What is Stress Relaxation Test
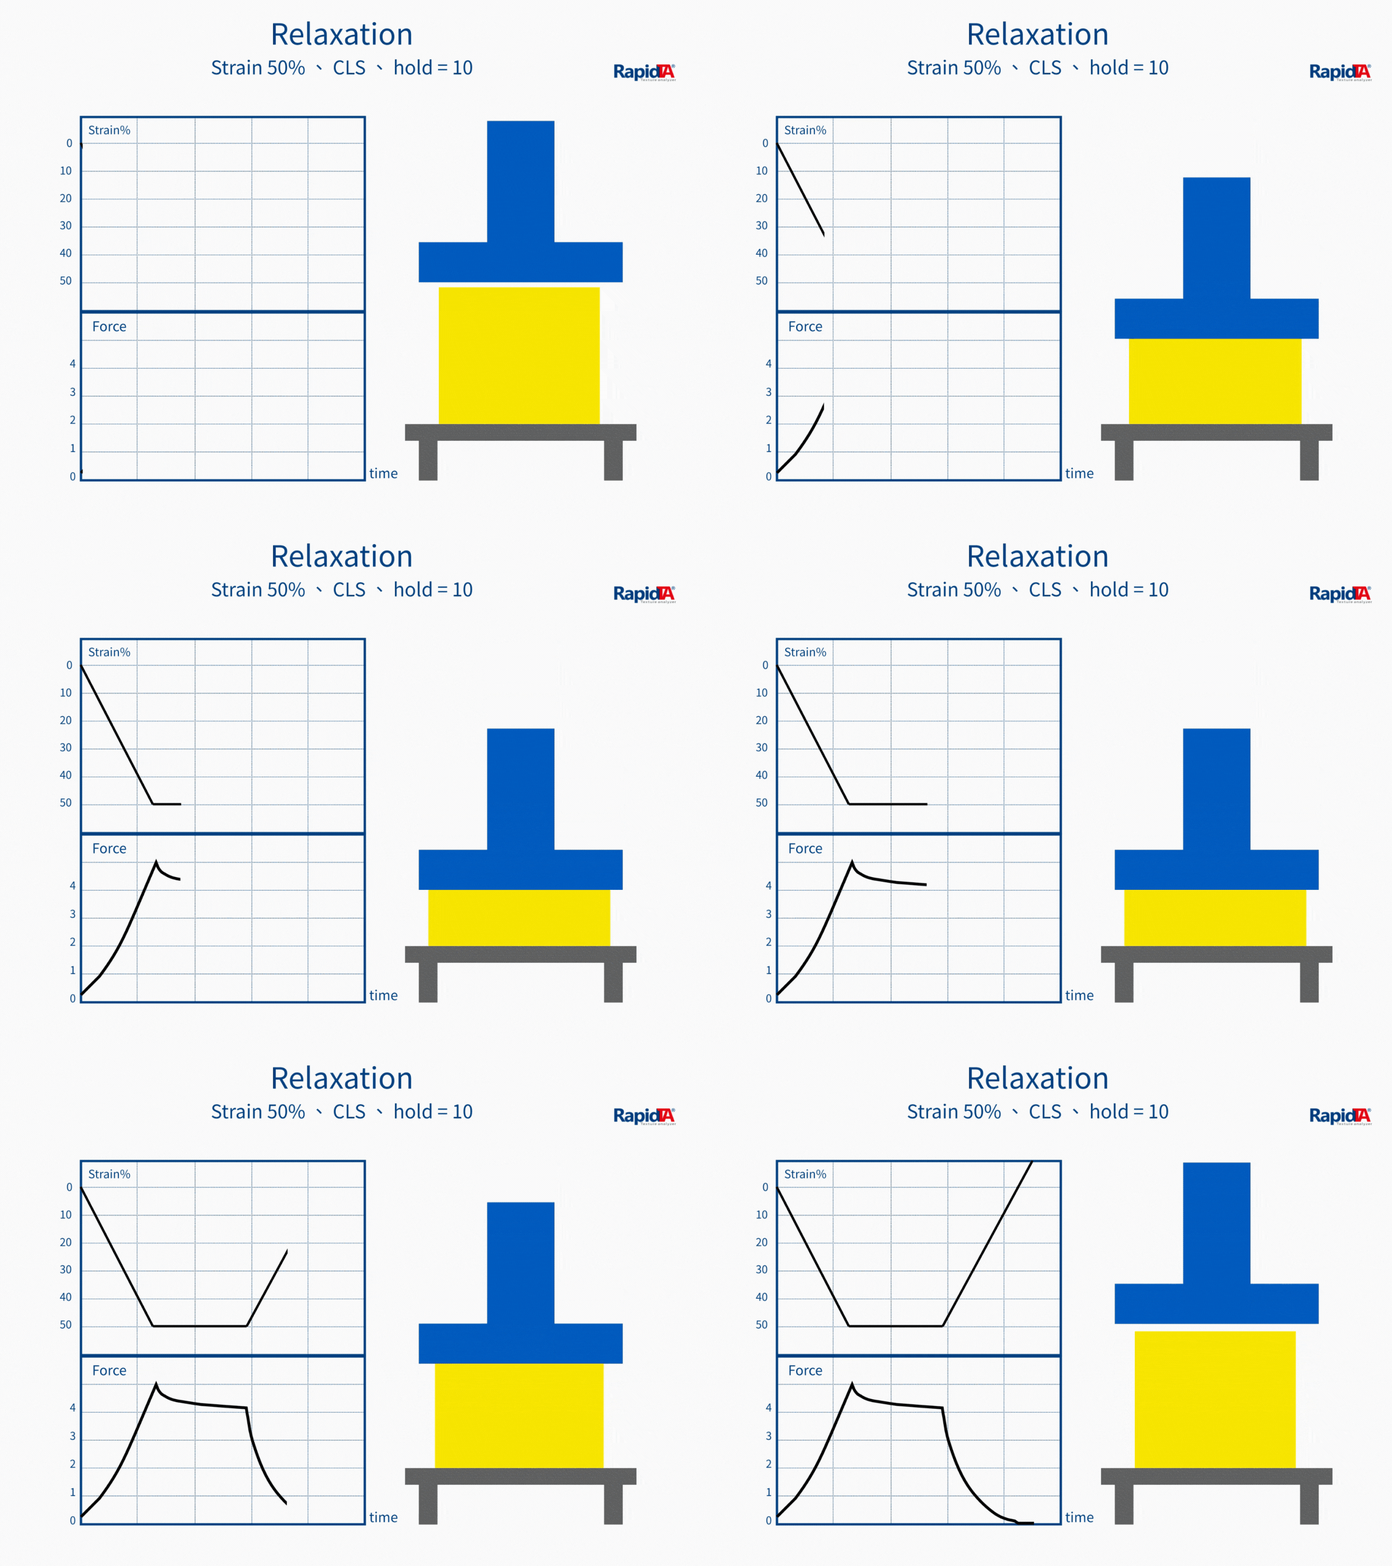
The stress relaxation test compresses to a set depth, holds still, and records how force decays over time. This reveals the sample's viscoelastic behavior and suits aging and shelf-life studies of baked goods.
Application Domains
Texture Properties Measured
Part 2
Principle & Operating Procedure
Principle
The probe compresses to a set depth and holds still (delay phase) while force decay over time is recorded. This gives viscoelasticity and springiness recovery — unlike TPA's double compression, it suits aging and shelf-life studies of baked goods.
Operating Procedure
Press to trigger
The probe presses to the trigger force (e.g. 5 gf) and recording starts.
Compress to depth
Compress at the set speed to the target strain (e.g. 25%).
Hold (relaxation)
Hold the position and record the force decay (e.g. 60 s).
Return
After the hold the probe returns to the start.
Recommended Settings
Standard or suggested parameters by sample and application — use them as a starting point.
Sponge cake aging case settings
| Parameter | Setting |
|---|---|
| Test mode | Strain (c) |
| Probe | Ø 36 mm cylinder probe, stage |
| Test speed | 1 mm/s |
| Trigger force | 5 gf |
| Target strain | 25% (sample height) |
| Hold time | 60 s |
Part 3
Probe Selection & Characteristics
Probe and fixture choice strongly affects accuracy and repeatability. The probes and kits below are commonly used for this action — select one to see its samples.
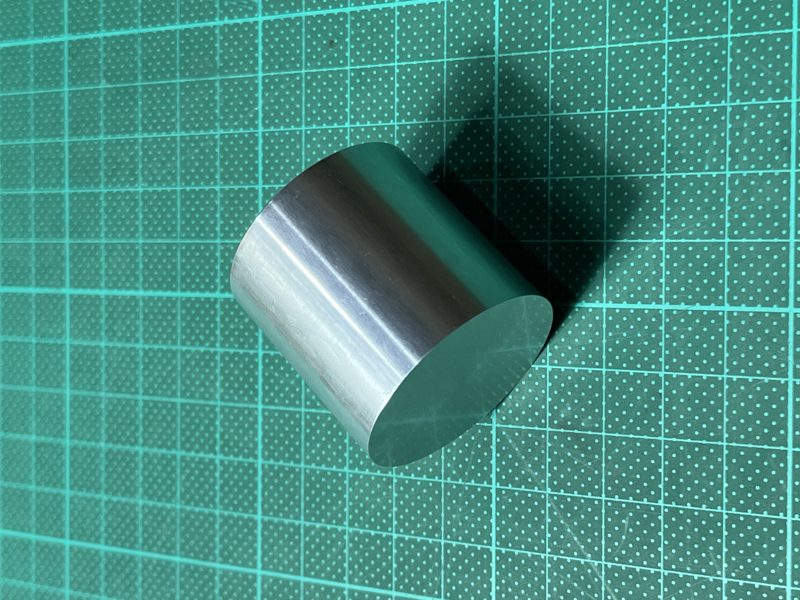
Ø 36 mm cylinder probe
Ø 36 mm + stage
Sponge cake, muffins, bread
Per AACC 74-09 and AIB
View probe & test kit →
Ø 18 mm cylinder probe
Ø 18 mm
Muffin shelf life
Modified AACC method
Part 4
Data Interpretation & Analysis
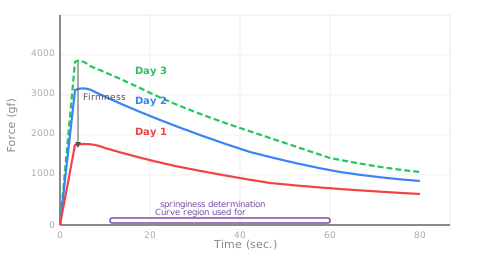
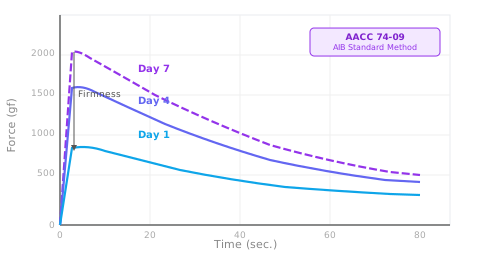
The relaxation curve shows force decaying after compression. The peak indicates firmness; residual force F₆₀ after a 60 s hold reflects viscosity; springiness recovery = F₆₀ ÷ F_max × 100%. The more the force decays, the stronger the viscous behavior. Aged samples typically get firmer and recover less.
Test Curves & Diagrams
Parameters & Calculations
After a test, the software calculates these parameters from the curve
Firmness
Peak compression force — rises with storage time as the sample ages.
Formula:Peak compression force
Springiness recovery
Share of force kept after the 60 s hold — elasticity.
Formula:% Recovery = F₆₀ ÷ F_max × 100%
Relaxation ratio
Share of force that decays during the hold — viscoelasticity.
Part 5
Application Cases
Applicable Test Samples
These samples use this action — select one for the full test information
Application Cases & Data Examples
Sponge cake — storage aging, firmness and springiness (No. M014)
Measure firmness and springiness recovery (% springiness) on sponge cake stored 1, 2 and 3 days to track aging. Use the Ø 36 mm cylinder for whole-piece compression; the sample surface must exceed the probe diameter. Keep sample height the same for every test, or the 25% strain will mean different probe travel.
| Storage | Mean firmness ± SD | Springiness recovery ± SD |
|---|---|---|
| Day 1 | 1017.1 ± 37.8 gf | 51.3 ± 0.4 % |
| Day 2 | 2709.1 ± 118.9 gf | 31.1 ± 1.4 % |
| Day 3 | 3438.3 ± 136.6 gf | 30.3 ± 2.0 % |
Muffin — internal crumb shelf life (AIB / AACC 74-09)
Use the Ø 18 mm cylinder, specified by AIB / AACC 74-09. The smaller diameter tests the soft inner crumb and avoids the crust, showing internal hardening precisely. Suited to small baked products.
Part 6
Frequently Asked Questions
How does relaxation differ from the TPA double compression?
Relaxation compresses to a target, holds, and records force decay over time — suited to viscoelasticity and shelf life. TPA does two continuous compressions for 8 texture parameters. Relaxation outputs peak force, held force and a springiness ratio, suited to bakery aging studies.
What is the difference between AACC 74-09 and AIB?
AACC 74-09 is the AACC standard for bread texture, widely used in bakery QC. The AIB method is a revised version endorsed by the American Institute of Baking, using Novo Nordisk (B974a-GB) corrected parameters. It suits small bakery products such as muffins for shelf-life work and uses an 18 mm cylinder probe.
How do I set the best hold time?
Set it by sample and goal. Bakery products: 60 s captures the decay trend. Soft gels: 30 s. For longer creep behavior, 120 s or more. Run a pilot to see how long the curve takes to flatten, then fix the hold time.
What sample height does relaxation require?
In strain (%) mode, different heights mean different probe travel, which breaks comparability — cut samples to a standard height such as 25 mm. In distance mode, every sample must be taller than the set compression distance so the probe never touches the stage.
How do I read a spike on a relaxation curve?
On older, firmer cake, a spike can appear because the cylinder edge cuts the sample rather than compressing it. When it appears, record the firmness before the spike, consider a larger probe to spread load, or adjust the target strain.
Related Test Actions
Creep Test
Holds a constant stress and tracks slow deformation over time — viscoelastic behavior.
Learn More →
Compression Test
Measures mechanical response under compressive load — for hardness and springiness.
Learn More →
Burst Test
Biaxial loading of films and sheets — burst strength and extensibility.
Learn More →
Not sure which texture test method fits your product?
Feel free to share your testing needs anytime — we provide free test method recommendations, custom fixture selection, instrument model suggestions, and tailored quotes.