Food Vision & Image Analysis Platform
RapidVA Food Vision Analysis System
Food image analysis × machine vision × quantified food quality
RapidVA combines machine vision and food image analysis to measure color difference, GLCM texture, porosity, food size and time-lapse change. It helps food producers set quantifiable, traceable quality standards.
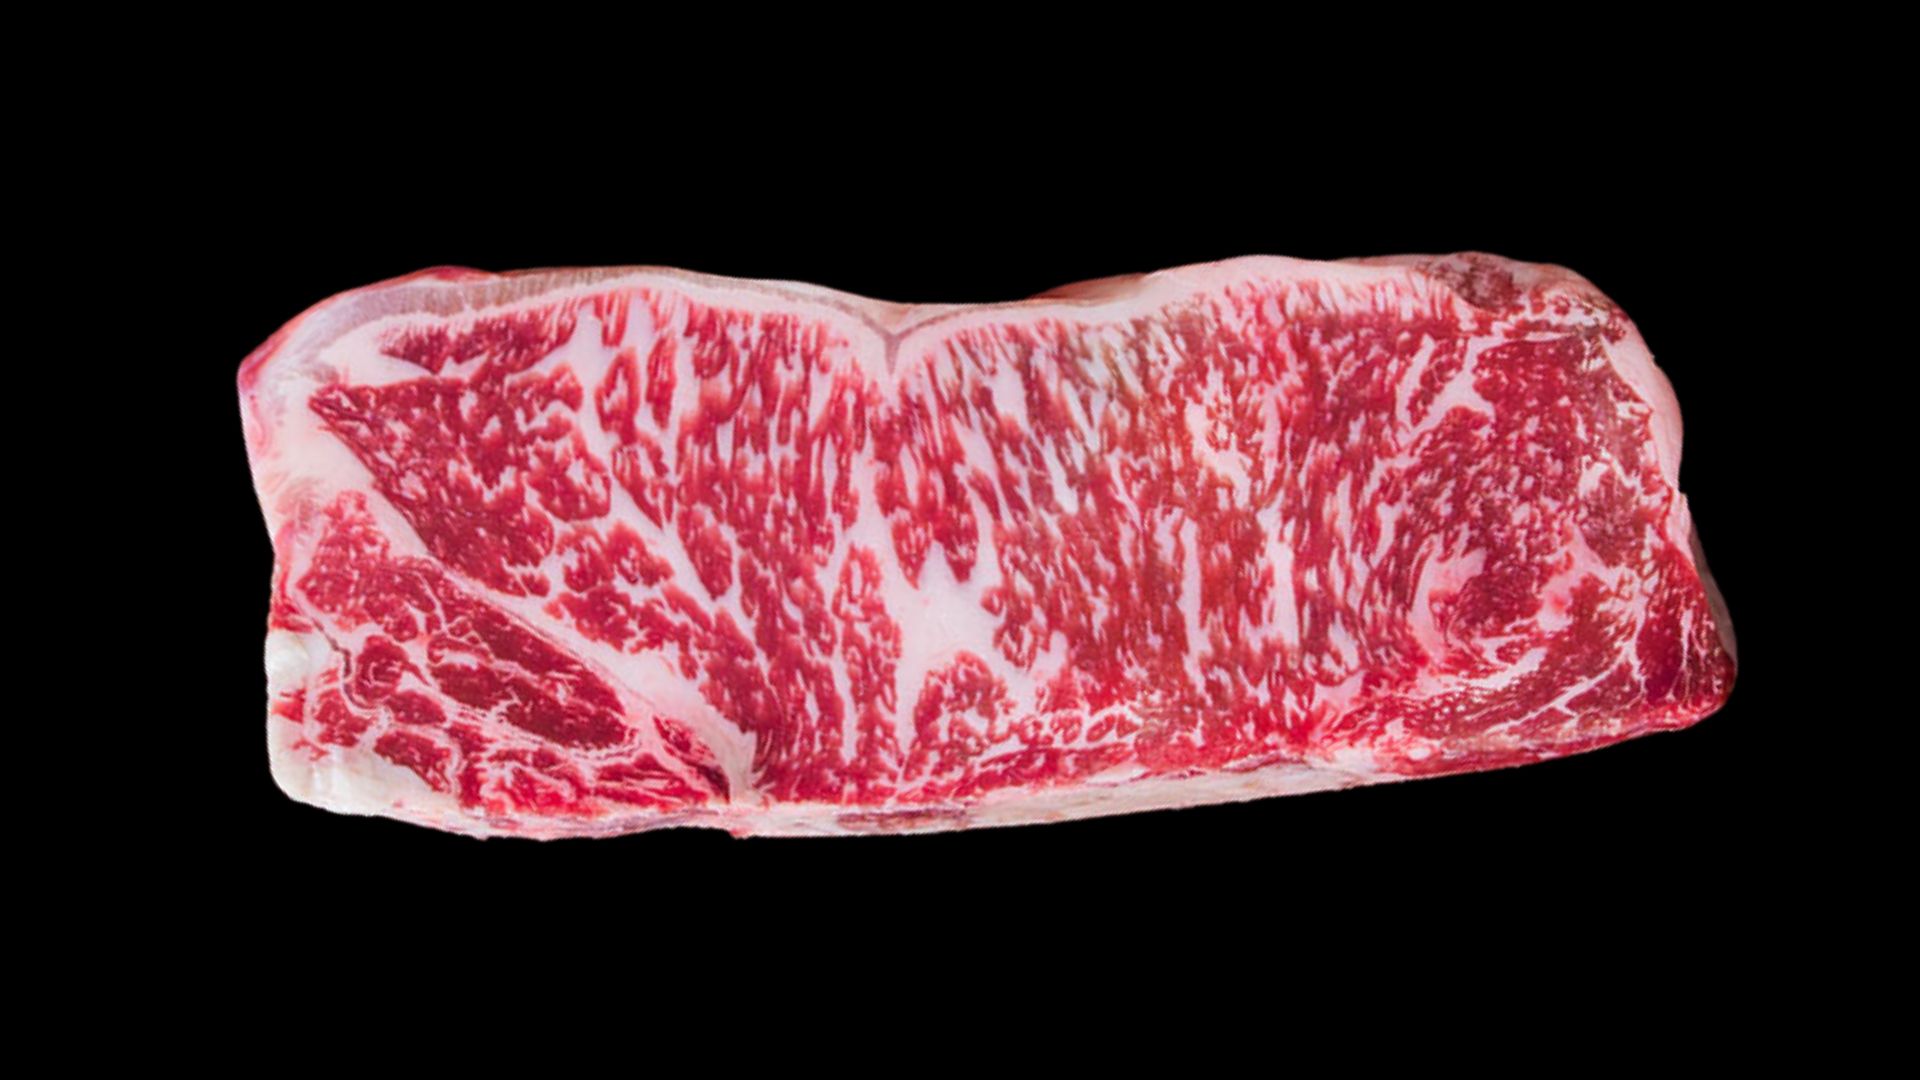
Image analysis example
CIELAB Color Analysis
Quantified in the L*a*b* color space
GLCM Texture Analysis
Quantified with gray-level co-occurrence matrices
Bread Porosity Analysis
Pore density and size
Food Size Measurement
Length, roundness, area
MODULES
Six core food image analysis modules
Built on food vision analysis and machine vision, RapidVA turns subjective sensory judgments into scientific data, giving R&D, quality control and automated grading one consistent standard.
Coverage Analysis
Food Coverage Analysis
Automatically analyzes batter pickup, ingredient coverage and fat distribution for fried, meat and processed foods.
Morphology Analysis
Food Size Analysis
Automatically calculates length, width, roundness, perimeter and area, replacing manual calipers and grading.
CIELAB · Delta E
CIELAB Color Analysis
Quantifies browning, ripening and baking color in the CIELAB L*a*b* color space.
Porosity
Bread Porosity Analysis
Analyzes pore density, pore size and porosity to refine crumb structure and texture consistency.
Texture Analysis
GLCM Texture Analysis
Uses gray-level co-occurrence matrices (GLCM) to analyze roughness, cracks, crispness and surface texture.
Time-lapse
Time-lapse Tracking
Tracks ice cream melting, dough proofing and produce fading to build food stability curves.
APPLICATIONS
Food industry applications
RapidVA suits meat processing, bakery, frozen food, fresh produce and food research institutes, building machine-vision quality control into every step.
Meat marbling analysis
Quantifies the fat ratio, muscle texture and color uniformity of steaks to standardize meat grading.
Bakery porosity analysis
Analyzes bread porosity, pore size and crumb uniformity to optimize proofing and baking parameters.
Frozen food stability analysis
Monitors shape change, ice crystal structure and melting rate after thawing.
Fresh produce color analysis
Uses CIELAB color difference to quantify ripeness, browning and color uniformity.
OVERVIEW
What is food vision analysis?
Food vision analysis uses image processing and machine vision algorithms to turn a food's appearance, color and structure into quantifiable data.
Food image analysis covers color difference, porosity, size measurement and texture analysis, and is widely used in academic research and quality control.
WORKFLOW
Food quality quantification workflow
From image capture and ROI analysis to feature extraction and report output — a complete, automated food quality process.
- 1Image capture
- 2ROI analysis
- 3Feature extraction
- 4Report output
ARTICLES
Food vision analysis articles
Learn the principles and applications of food vision analysis, machine vision and each analysis technique.
FAQ
Frequently asked questions
- What is a food vision analysis system?
- A food vision analysis system uses machine vision and image analysis to turn color, size, porosity and texture into quantified quality indicators.
- What is GLCM texture analysis?
- GLCM (gray-level co-occurrence matrix) quantifies surface roughness, crispness and texture uniformity.
- Which food industries is RapidVA suited to?
- Meat processing, bakery, frozen food, fresh produce and food R&D institutes.
Book a live RapidVA demo
Bring your own product. We will run color difference, porosity, GLCM texture and size measurements live on site.