
Tension / Extensibility Test
Pulls the sample vertically to measure extension and breaking force — extensibility and tensile strength.
Part 1
What is Tension / Extensibility Test
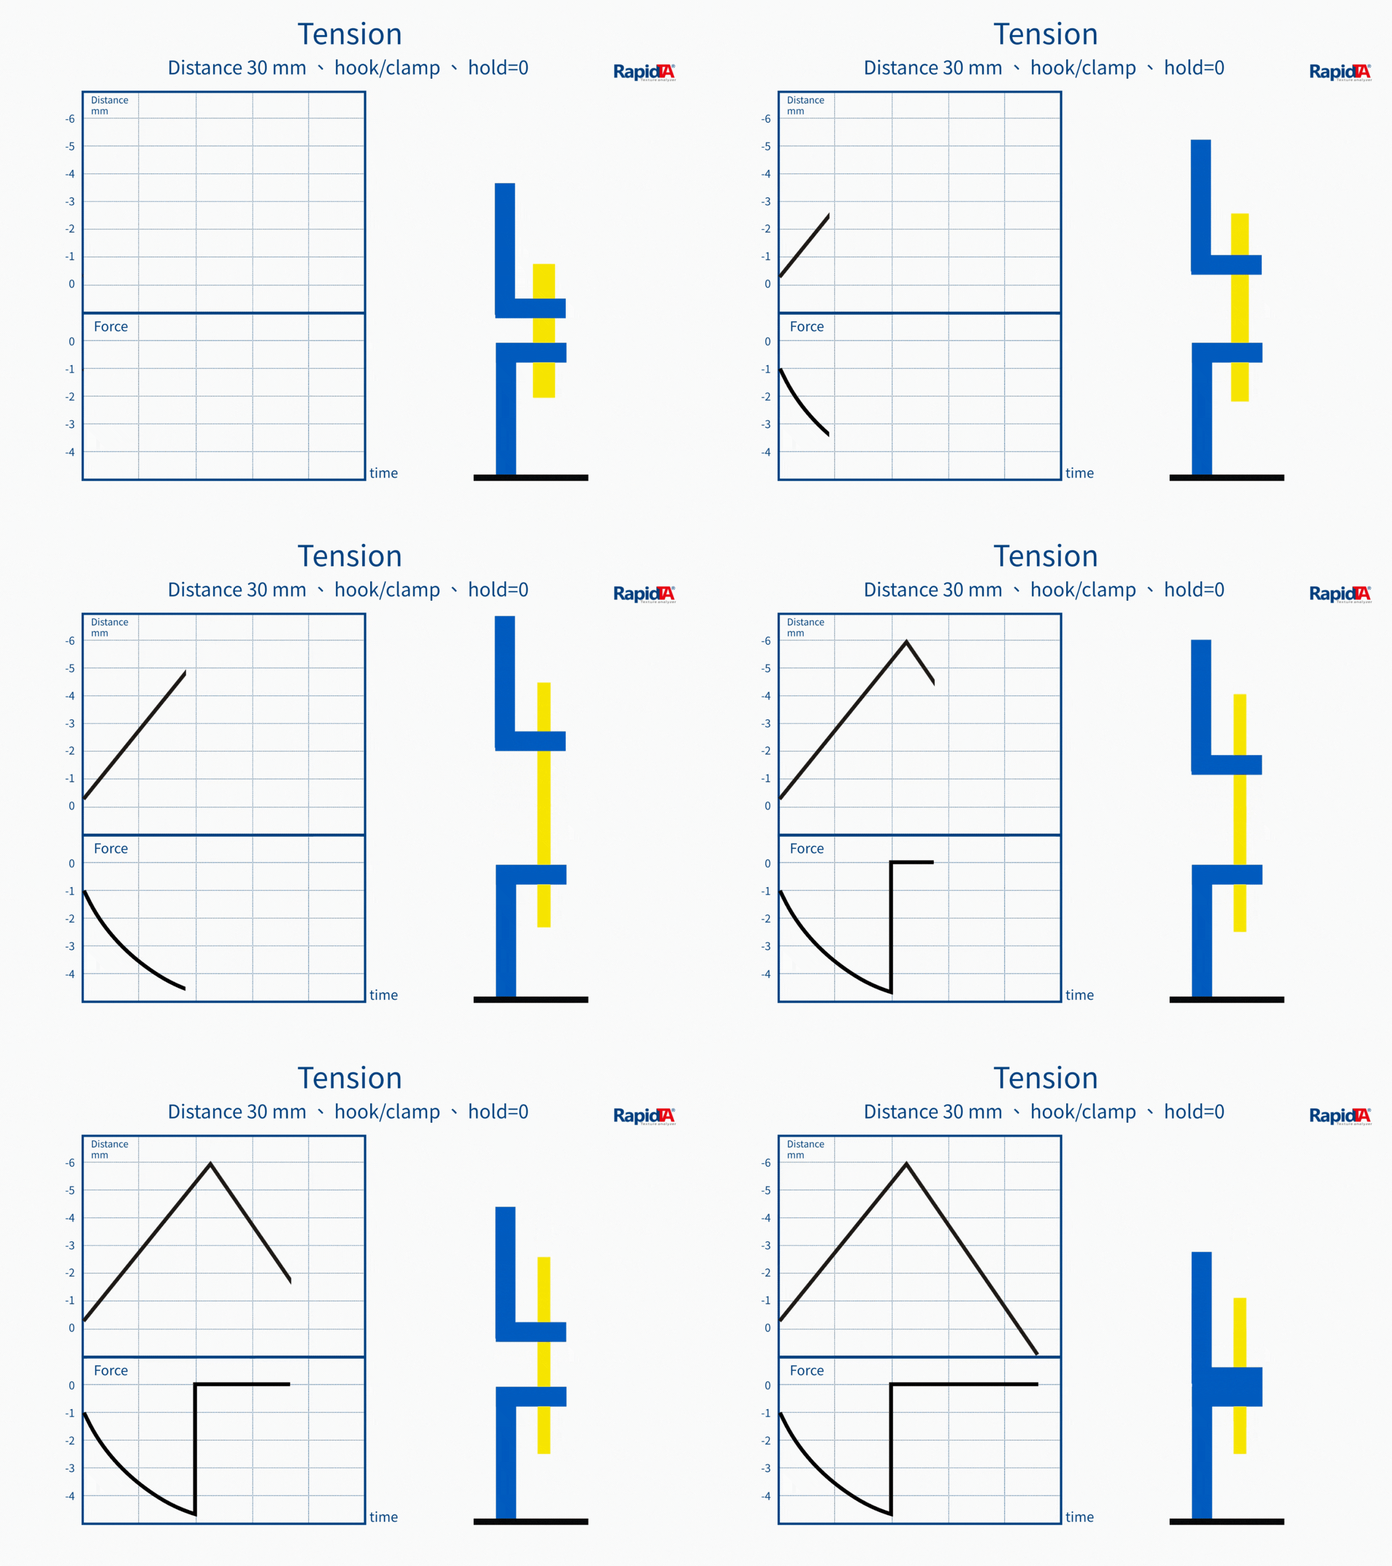
The tension test applies a vertical pulling force and records force and displacement from the first load to fracture (or maximum extension), evaluating extensibility and tensile strength. Common for dough, noodles, cheese and confectionery.
Application Domains
Texture Properties Measured
Part 2
Principle & Operating Procedure
Principle
The sample is held in grips and pulled vertically. Force and displacement are recorded from first load to break (or maximum extension), rating extensibility and tensile strength. Better than compression for gluten and stringiness.
Operating Procedure
Mount grips and zero
Fit the tensile grips and zero force and displacement.
Place the sample
Clamp the sample between the grips, aligned with the right tension.
Trigger contact
Recording starts when the trigger force is reached.
Stretch to target distance
Stretch at the set speed until break or target distance.
Record break and return
Record the break point; the probe returns to the origin.
Part 3
Probe Selection & Characteristics
Probe and fixture choice strongly affects accuracy and repeatability. The probes and kits below are commonly used for this action — select one to see its samples.
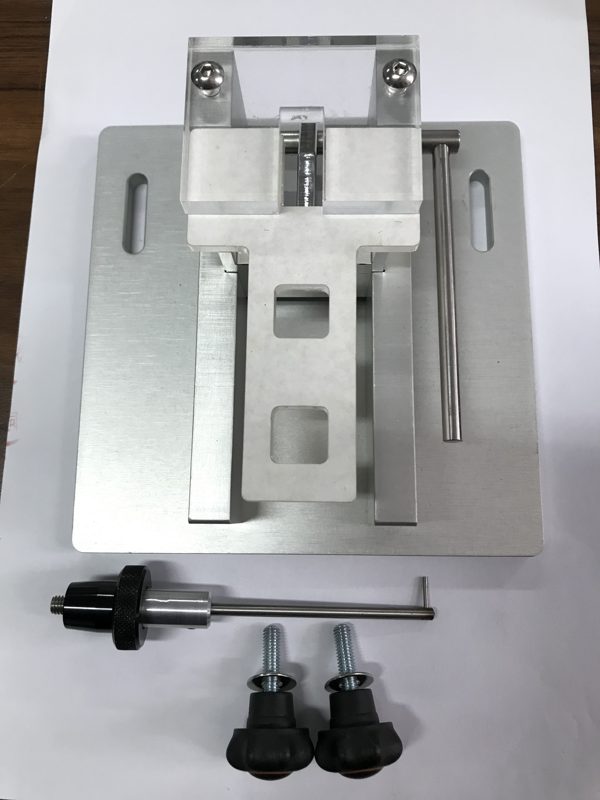
Dough extensibility rig (Kieffer)
Dough stretch fixture
Dough, gluten strands
Key outputs: extensibility and gluten quality
View probe & test kit →
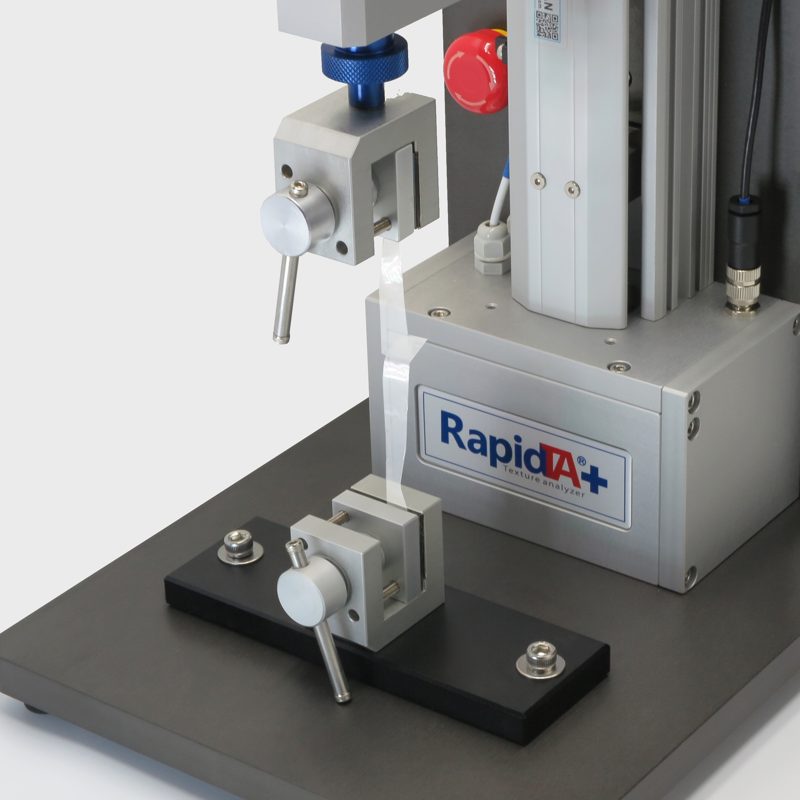
Double C-clamp fixture
Double C-clamp
Tortillas, chewy candy sheets
Key outputs: peak force, extension, break point
View probe & test kit →
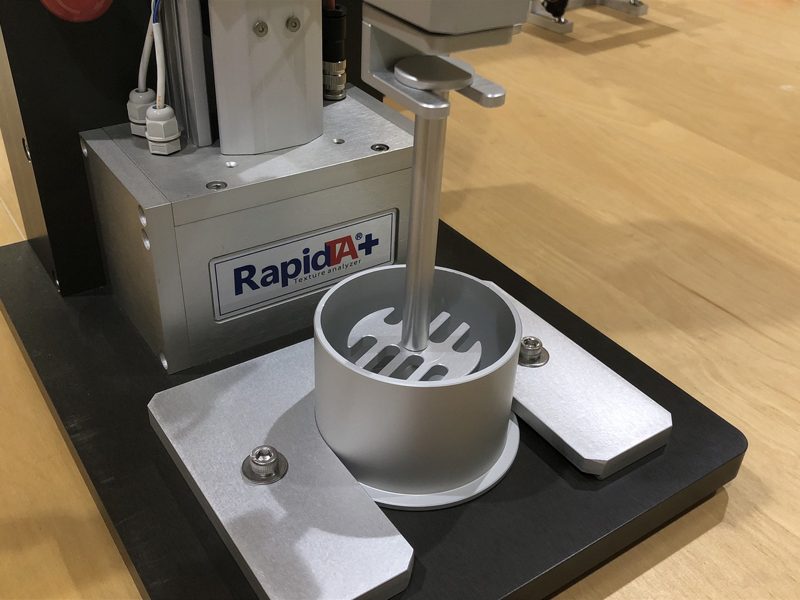
Cheese stretch rig
Cheese stretch fixture
Melted cheese, mozzarella, heated cheese
Key outputs: stretch distance, peak force, break energy
View probe & test kit →
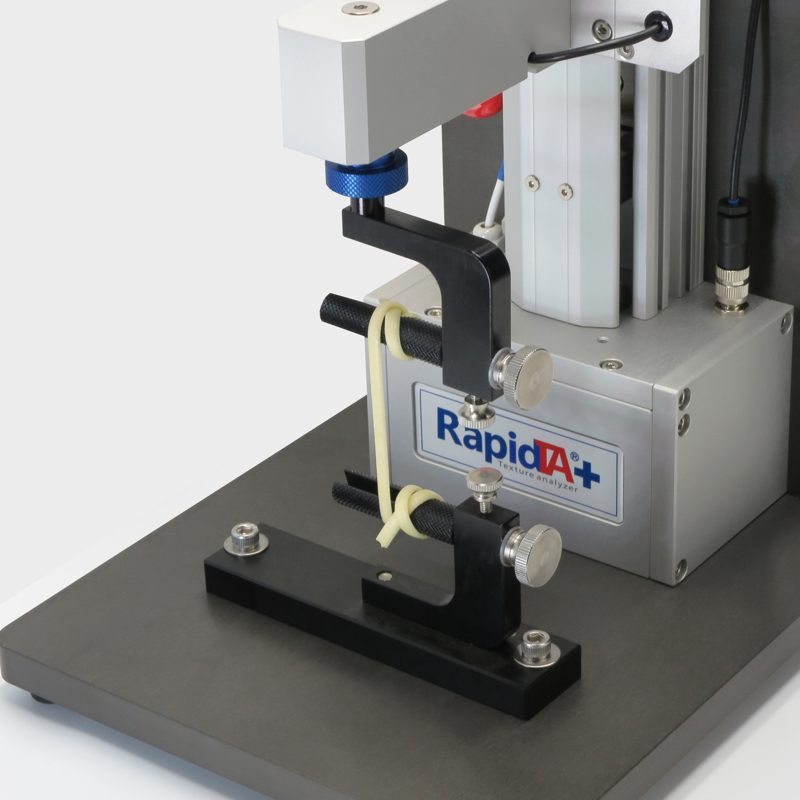
Noodle stretching rig
Noodle fixture
Cooked noodles, pasta, lasagne
Key outputs: tensile strength, extensibility, break energy
View probe & test kit →
Part 4
Data Interpretation & Analysis
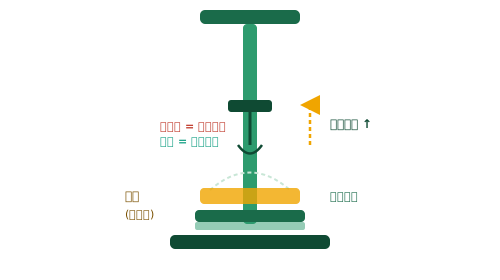
The peak force is tensile strength; distance to peak reflects extensibility; the area under the force–displacement curve (gf·mm or N·mm) is the stretching energy, summarizing extension and tensile behavior.
Test Curves & Diagrams
Parameters & Calculations
After a test, the software calculates these parameters from the curve
Extensibility
Distance stretched before break — dough or gluten stretch capacity.
Formula:Distance to break
Tensile strength
Peak force during stretching — resistance to pulling.
Formula:Peak force
Distance at failure
Displacement at break — compares stringiness and extension.
Part 5
Application Cases
Applicable Test Samples
These samples use this action — select one for the full test information
Part 6
Frequently Asked Questions
How does dough tension testing differ from the Farinograph?
They measure different things. The Farinograph assesses mixing traits such as water absorption and dough development time. Dough tension measures tensile strength and extension distance as the dough stretches, showing gluten network mechanics during proofing and shaping — more useful for products like bread and steamed buns that must stretch.
Why must cheese stretch tests run at a set temperature?
Cheese stretch is very temperature-sensitive. Too cool and it will not flow and stretch; too hot and viscosity drops, lowering force. A standard temperature (e.g. 60 °C) is needed for comparable data — use a temperature-controlled chamber to reflect pizza and gratin use.
How do I stop noodles slipping out of the grips?
(1) Use grips with a textured, non-slip surface; (2) grip firmly enough without over-squeezing, which can cause early breaks; (3) blot excess water off cooked noodles before gripping; (4) add sandpaper or rubber pads to the contact faces. If slipping persists, slow the test or move the grip position.
How does test speed affect tension results?
Speed changes what viscoelastic samples show. Slow (e.g. 1 mm/s) gives time to relax: more extension, less resistance. Fast (10 mm/s+) behaves stiffer: more force, possibly less extension. Use the industry standard for each food (dough commonly 3.3 mm/s) and state it in the report.
How should a chewy candy temperature series be planned?
Center the series on mouth temperature (37 °C) and extend both ways, e.g. 15, 25, 37 and 45 °C. Hold each sample at temperature for at least 30 minutes before testing. The result is a temperature–extension curve that shows how texture holds up across climates and use conditions.
Related Test Actions
Extrusion Test
Forward, back and bulk extrusion — rating consistency, firmness and crispness.
Learn More →
Burst Test
Biaxial loading of films and sheets — burst strength and extensibility.
Learn More →
TPA (Texture Profile Analysis)
One test returns hardness, springiness, cohesiveness and more — simulating human chewing.
Learn More →
Not sure which texture test method fits your product?
Feel free to share your testing needs anytime — we provide free test method recommendations, custom fixture selection, instrument model suggestions, and tailored quotes.